
Lec 1 Dr.Farah Sameer Yahya Wed, 9/Oct/2019
Pediatrics
The field of medicine that is concerned with the health of infants, children, and
adolescents; their growth and development; and their opportunity to achieve full
potential as adults.
The American Academy of Pediatrics recommends people be under pediatric care
up to the age of 21.
A medical doctor who specializes in this area is known as a pediatrician.
Differences between adult and pediatric medicine
The body size differences are paralleled by maturation changes
The smaller body of an infant or neonate is substantially different physiologically
from that of an adult
Congenital defects, genetic variance, and developmental issues are of greater
concern to pediatricians than they often are to adult physicians.
Remember that children are not simply "little adults"
The clinician must take into account the immature physiology of the infant or child
when considering symptoms, prescribing medications, and diagnosing illnesses.
CHILD GROWTH AND DEVELOPMENT
Child growth and development is a complex process, which includes not only physical growth, but also the
maturity of systems, development of functioning, The process of growth and development is influenced by
a variety of internal and external factors.
Therefore it is one of the most important goals of pediatric to monitor and improve child growth and
development, personality, and behaviors
Growth
an increase in the number and, size of cells as they divide and synthesize new proteins; results
in increased size and weight of the whole or any of its parts.
can be viewed as a quantitative change.
Development :
is an increase in function of processes related to body and mind.
can be viewed as a qualitative change
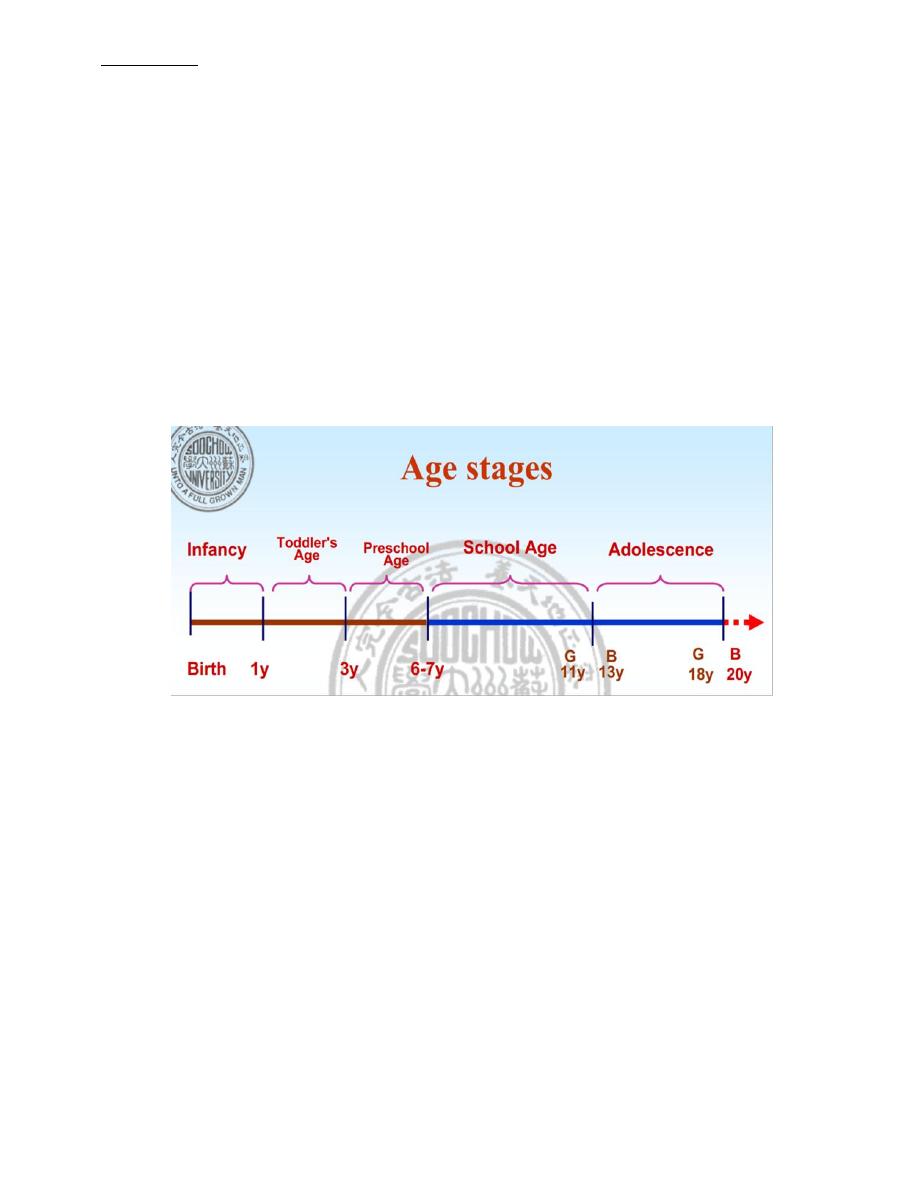
Maturation an increase in competence and adaptability; a change in the complexity of a structure that
makes it possible for that structure to begin functioning to function at a higher level.
All of these processes are interrelated, simultaneous, and ongoing processes; none occurs apart
from the others.The processes depend on a sequence of endocrine, genetic, constitutional,
environmental, and nutritional influences. The child's body becomes larger and more complex.
Periodically monitoring each child for the normal progression of growth and development &
screening for abnormalities are important. The AAP recommends routine office visits in the first wk
of life (depending on nursery discharge); at 2 wk; at 2, 4, 6, 9, 12, 15, and 18 mo; at 2 yr and
annually up to age 6; and every 2 years between age 6 and adolescence.
Deviations in growth patterns may be nonspecific but may be important indicators of serious and
chronic medical disorders. An accurate measurement of height, weight, and head circumfere nce
should be obtained at every health supervision visit.
The
Following summarizes several convenient bench marks (thumb rules) to
evaluate normal growth:

OFC increase in the 1
st
year of life
Birth
35 cm
0-3 mo
↑ 2cm/mo
3-6 mo
↑ 1cm/mo
6-12 mo
↑ ½ cm /mo
1 yr
47 cm
OFC after the 1
st
year of life
1 year
47 cm
2 years
49 cm
3 years
50cm
6 years
52 cm
10 year
53 cm
adult
56 cm

Factors affecting growth and development
Both nature (genetics) and nurture play roles in physical development .
Nurture mean that the environment the child raise in can affect physical growth and development .
Examples of nature and nurture factors:
Heredity
Gender internal factors (nature)
Prenatal Influences
Nutrition
Diseases
Interpersonal Relationships external factors (nurture)
Environmental Hazards
Seasons and Climates
Assessment of Growth
Growth assessment is an essential component of pediatric health surveillance. Many biophysiologic and
psychosocial problems can adversely affect growth, and aberrant growth may be the first sign of an underlying
problem.
The most powerful tool in growth assessment is the growth chart used in combination with accurate
measurements of height, weight, and head circumference.
In 2000, the Centers for Disease Control and Prevention (CDC) published revised growth charts. These charts
contain data from five national surveys conducted between 1963 and 1994.
The data are presented in 5 standard gender-specific charts:
(1) weight for age;
(2) height (length and stature) for age;
(3) head circumference for age;
(4) weight for height (length and stature) for infants; and
(5) BMI for children over 2 yr of age
Each chart is composed of 7 or 8 percentile curves, representing the distribution of weight, length, stature, or
head circumference values at each age.
The percentile curve
indicates the percentage of children at a given age on the x-axis whose measured
value falls below the corresponding value on the y-axis.
On the weight chart for boys 0–36 mo of age the 9 mo age line intersects the 25th percentile curve at 8.6 kg,
indicating that 25% of the 9 mo old boys in the National Center for Health Statistics sample weigh less than 8.6 kg
(75% weigh more). Similarly, a 9 mo old boy weighing more than 11.2 kg is heavier than 95% of his peers.
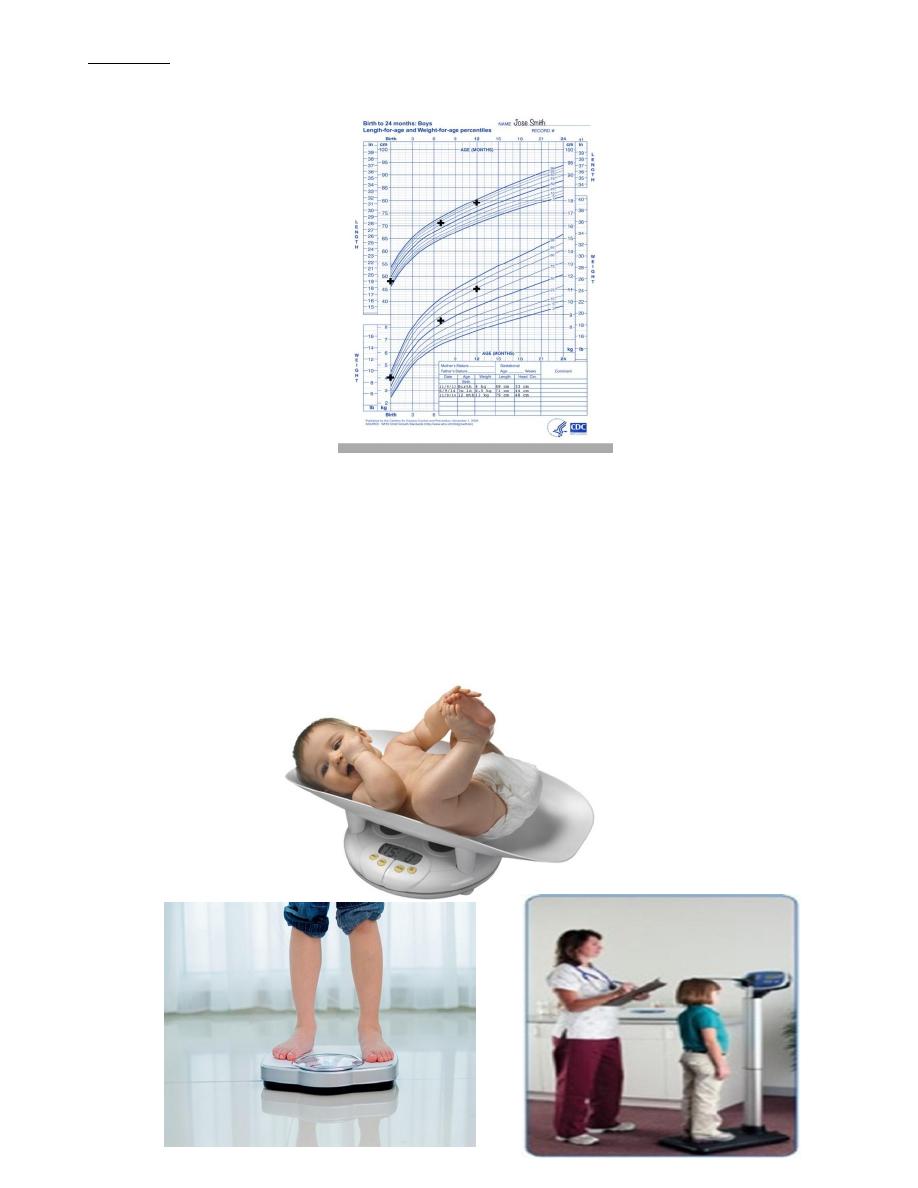
The median, or 50th percentile is also termed the standard value, in the sense that the standard height for a 7 mo
old girl is 67 cm .
PROCEDURES FOR ACCURATE MEASUREMENT
Accurate measurement is a key component of assessing growth. For infants, weight, length, and head
circumference are obtained.
Weight, in pounds or kilograms, must be determined using an accurate scale.
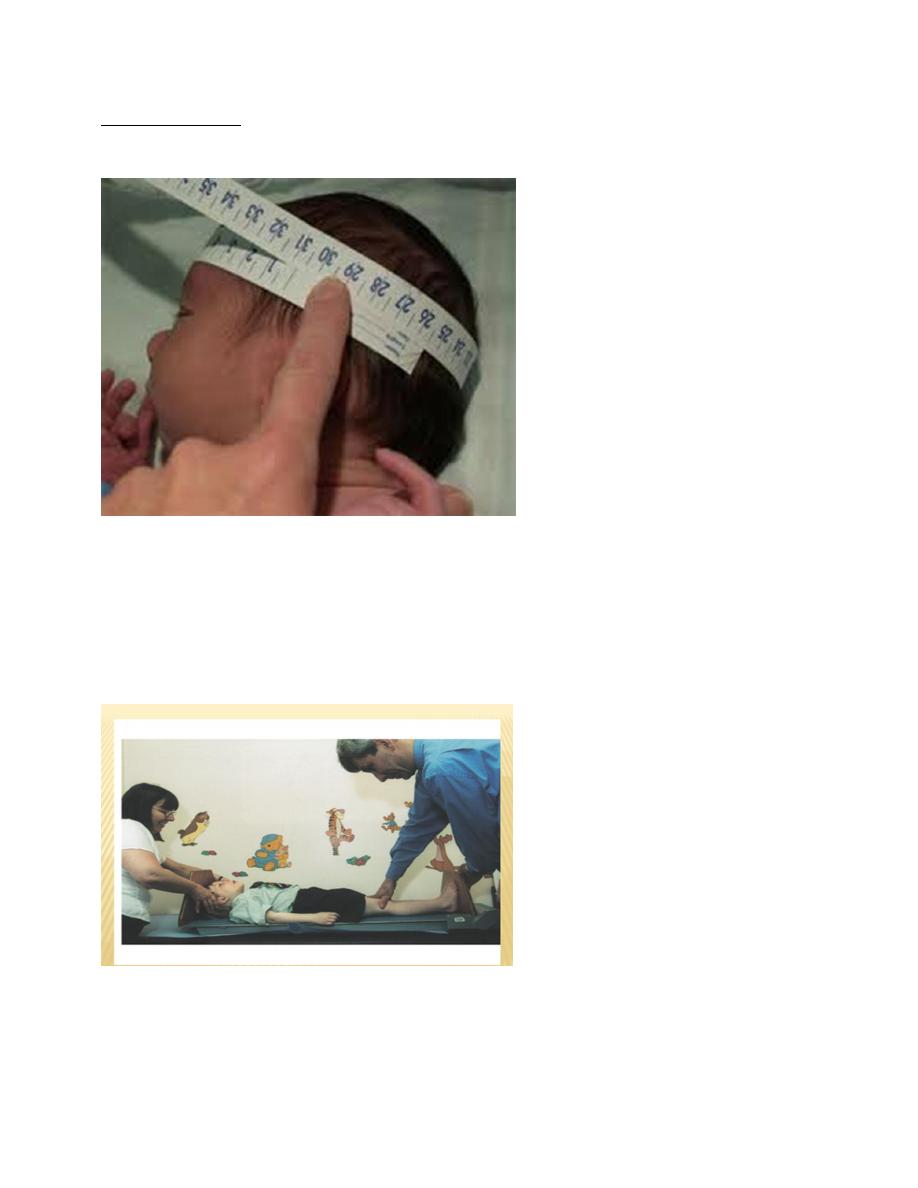
Head circumference is determined using a flexible tape measure run from the supraorbital ridge to the occiput in
the path that leads to the largest possible measurement.
Length (for children <2years) is most accurately measured by two examiners (one to position the chil d), with the
child supine on a measuring board.
For older children, the measure is stature or height, taken using a stadiometer.
The most common reasons for deviant measurements are technical (i.e., faulty equipment and human errors in
measurement or plotting).
.
The BMI
is defined as body weight in kilograms divided by height in meters squared.
The BMI is an index for classifying adiposity and is recommended as a screening tool for children and adolescents
to determine whether an individual is overweight (BMI above the 95th percentile for age) or at risk for being
overweight (BMI between the 85th and 95th percentile for age).
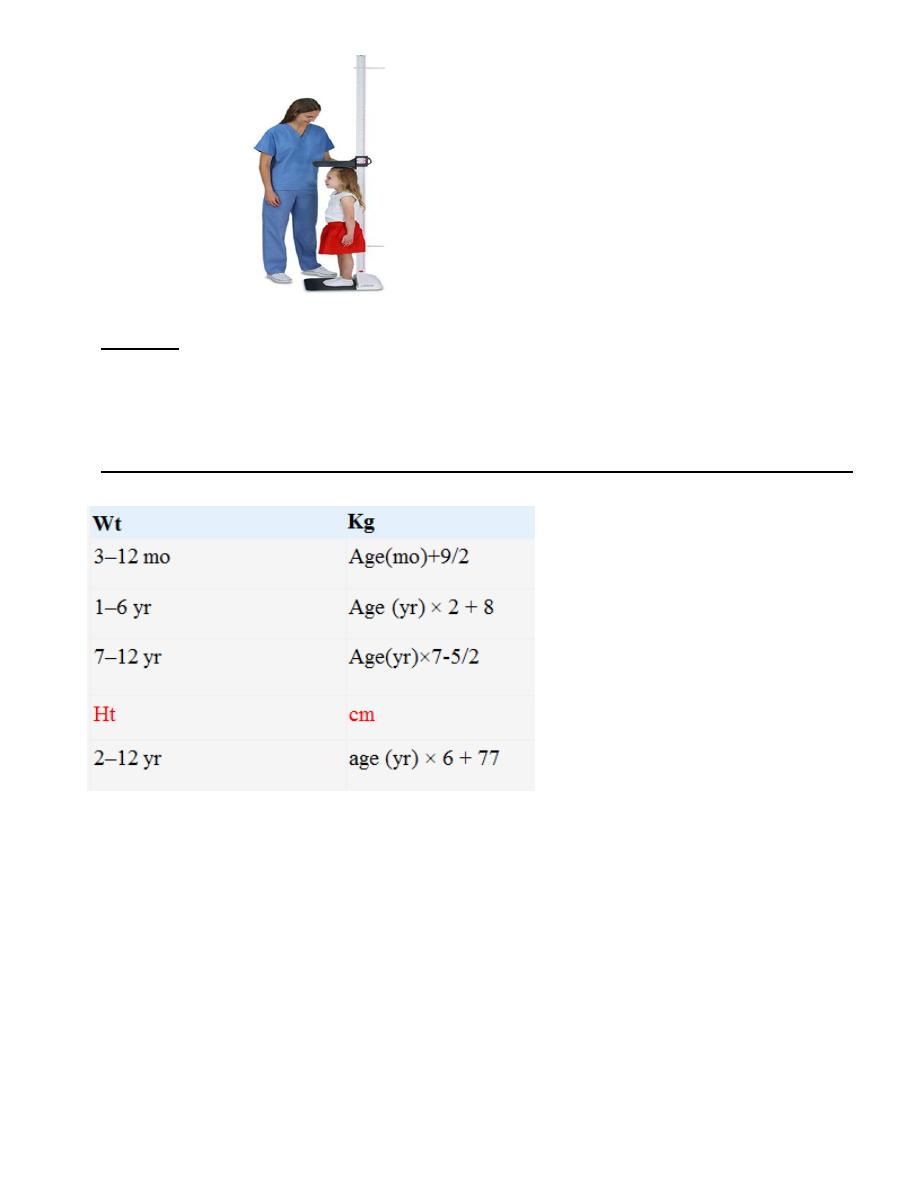
Formulas for Approximate Average Height and Weight of Normal Infants and Children
Separate growth charts are available for:
very low birth weight infants (weight <1500 g)
Turner syndrome
Down syndrome
achondroplasia
other dysmorphology syndromes.
It is important to correct for various factors in plotting and interpreting growth charts. For
premature infants, over diagnosis of growth failure can be avoided by using growth charts
developed specifically for this population.
A cruder method, subtracting the weeks of prematurity from the postnatal age when plotting
growth parameters, does not capture the variability in growth velocity that VLBW infants
demonstrate.

While VLBW infants may continue to show catch-up growth through early school age,
most achieve weight catch-up by 24 mo , height catch-up by 40 mo and OFC catch-up
by 18 mo of age
Mid parental height
In the assessment of a child’s growth potential, calculation of mid parental (or target) height is essential.
Mid parental height is calculated in
inches
as follows:
Boys: [(maternal height + 5) + paternal height]/2
Girls: [maternal height + (paternal height − 5)]/2
13 cm (instead of ± 5 in) if using metric units
BODY PROPORTIONS.
Body proportions follow a predictable sequence of changes with development. The
head and trunk are relatively large at birth, with progressive lengthening of the limbs
throughout development, particularly during puberty.
The lower body segment is defined as the length from the symphysis pubis to the
floor, and the upper body segment is the height minus the lower body segment.
The ratio of upper body segment divided by lower body segment (U/L ratio) equals
approximately 1.7 at birth, 1.3 at 3 yr of age, and 1.0 after 7 yr of age. Higher U/L
ratios are characteristic of short-limb dwarfism or bonedisorders, such as rickets.

Achondroplasia
SKELETAL MATURATION
It is gradual disappearance of the epiphysis of bones and their fusion with growth plates of
the bones and increase in the size of bones.
Normally there is 5 ossific centers at birth in
Lower end of femur
Upper end of tibia
Calcaneus ,talus ,cuboid
Carpal bones start ossification after birth as follow
the 1
st
carpal bone at 2 months
The 2
nd
carpal bone by the end of first year
Later on one carpal bone ossifies each year until the 6
th
year {=7 bones}
The 8
th
bone ossifies at 12 years
Bone age
corresponds more closely to sexual maturity, which depends on the maturation of the
endocrine system, than to chronologic age.
Newborn Baby Normal Ossification Center at Lower Femur and Upper Tibia
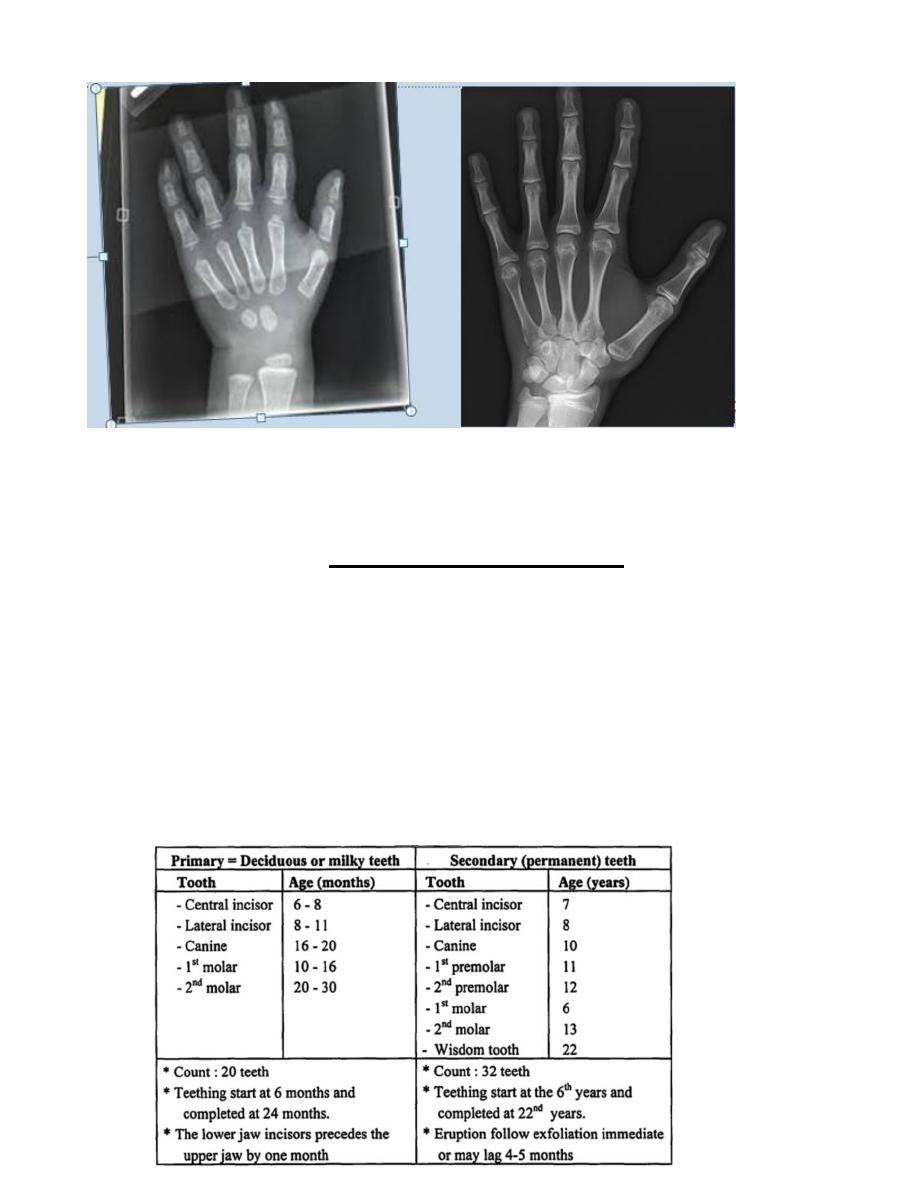
Xray of left wrist of a 2 years child vs adult
DENTAL DEVELOPMENT.
Dental development includes mineralization, eruption, and exfoliation . Initial
mineralization begins as early as the 2nd trimester and continues through 3 yr of age.
The average age of eruption of the primary teeth (20) is 6 months, and continue through 3rd
year, while permanent teeth (32) erupt by 6th yr and will not be completed until adulthood.
Delayed eruption is usually considered when there are no teeth by approximately 13 mo of
age.

