Methods of Data Presentation
Complete data gives you that you have accurate, the next consideration is how to organize it for analysis & for presentation to others.Usually the information of quantitative nature is first organize by tabulation it & often the process stop there. This is not always, or necessarily, bad tabulation data have some limitations. Foremost among these, especially when the amount of tabulated information is large as that the pattern & trends are difficult to identify & interpret. Graph & charts are very helpful in solving this problem. With them & assuming that data are tabulated into meaningful groups or intervals, pattern & trend become highly visible.
In order to be familiar with the methods of data & to be able to distinguish between chart, graph, & tables that display data clearly from those do not apply a measurements & graphical display of data these can be achieve by using :
Table
Graphs or Charts
1. Tables
Principles of table construction:
Table should be as simple as possible. generally three variables are the maximum number that can be read with ease.
Should be understandable without reference to text.
Codes , abbreviations, or symbols should be explained in details in footnotes.
Each raw or column should be labeled clearly.
The specific unit of measure for the data should be given.
The title should be clear, brief, & should answer the questions what?, why?, where?.
Totals should be given
The title commonly separated from the body of the table by lines or spaces.
If the data is not original, the source should be given in the footnote or in the title.
Summarization of data by master table.
2. Graphs :
is the pictorial display of quantitative data using a coordinate system where x is the horizontal axis & y is the vertical axis.
Principles:
Rectangular coordinate graph consist of two sets of lines at right angles to each other, each line containing a scale of measurement, the variable assigned to the x-axis is considered the method of classification(independent) & variable in the y-axis is the frequency of occurrence(dependent). We plot a change in Y with respect to X .
The simplest graph are the most effective , no more lines or symbols.
Every graph should be self explanatory.
Title may be placed at the top or the bottom of the graph.
Lines which outlines the graph itself (the axis) should be drawn heavier than other coordinate lines.
Frequency is usually represented on the vertical scale & the method of classification on the horizontal scale.
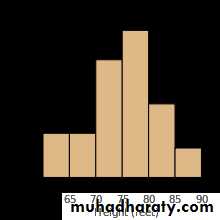
Histogram:
It is a graph of frequency distribution used for continuous variables.
Special features:
Width of the vertical bars is proportional to the width of class interval used.
The height of the bars in a class interval is proportional to the frequency of occurrence of the event in that class interval.
There is no spaces between columns
Bar chart:
This kind of chart uses bars all of them same width(unlike the histogram), there is always space between columns. This type is ideally suitable for presenting comparative data for discontinuous variables(A bar chart is very useful for recording discrete data).Bar graphs can also be used for more complex comparisons of data with grouped bar charts and stacked bar charts

Pie chart:
Use wedge shape portions of circle to illustrate the division of the whole into segments, the convention is to start at the 12 o'clock first & proceed clockwise around the chart. To convert from percentage to degrees multiply the percentage by (3.60 ) Since 360/100%=3.6Scatter diagram:

Several types of statistical/data presentation tools exist including:
(A) charts displaying frequencies e.g. bar & pie charts(B) charts displaying distributions e.g. histograms.
(C) charts displaying associations e. g scatter diagrams.